













Dirty Solar Panels: How Much Energy Yield Are You Losing?
-
soiling loss
-
energy yield
-
panel cleaning
-
solar monitoring
-
O&M
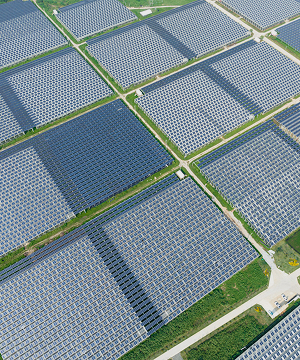
27%. That's the energy yield loss measured on heavily soiled solar panels under controlled comparison conditions — panels left uncleaned for an extended period in a polluted environment. The exact impact depends heavily on climate, installation angle, rainfall patterns, and maintenance frequency. 27% is the severe end of the spectrum, not the average. But even at the mild end, losses are larger than most system owners realize.
The Spectrum of Soiling Loss
| Soiling condition | Typical annual energy loss | Common scenarios |
|---|---|---|
| Clean residential roof, favorable conditions | 1–3% | Regular rainfall, good tilt angle, low pollution |
| Moderate dust and pollen buildup | 3–8% | Suburban areas, near trees, spring pollen season |
| Urban pollution + bird droppings | 5–15% | City rooftops, near roads, tropical urban environments |
| Severe neglect or harsh environments | 15–30%+ | Industrial zones, arid regions, extended periods without cleaning |
Most residential systems without regular maintenance experience annual soiling losses in the 5–12% range, depending on location and environmental conditions. Not catastrophic on any single day. But compounding silently over 25 years.
Why Spot Soiling Hurts More Than Uniform Dust
A thin uniform dust layer might cost 3–5%. But concentrated obstructions — bird droppings, stuck leaves, moss patches — cause disproportionately larger losses due to how solar cells are configured electrically.
A heavily shaded area can trigger bypass diode activation and reduce the output of affected cell groups. In string inverter systems, this impact can extend to the connected string depending on system design. A small shaded area can sometimes cause a disproportionately large output reduction, depending on where the obstruction occurs and how the module is configured.
A single bird dropping covering an active cell area can sometimes have a larger impact than a thin dust layer covering the entire module. This is why targeted cleaning of specific problem spots often recovers more production than a general rinse.
Climate and Location Factors
Tropical and subtropical regions:
- Higher humidity drives biological growth (algae, moss) that bonds to glass and resists rain
- Monsoon cycles create periods where light rain mixes with dust into adhered mud films — worse than dry dust alone
- Urban pollution in cities such as Ho Chi Minh City, Bangkok, and other rapidly growing urban areas means significantly higher particulate deposition rates
- Higher irradiance means the same percentage loss represents more absolute kWh lost
Temperate European regions:
- Spring pollen season can coat panels in a sticky film that rain doesn't fully remove
- Agricultural dust during planting and harvest creates seasonal spikes in soiling
- Bird droppings accumulate year-round, especially near nesting areas
- Snow residue and mineral deposits build up through winter-spring transition
The mechanisms differ, but the outcome is the same everywhere: uncleaned panels produce less than their potential, regardless of climate zone.
What This Means in Money
For a 10kW system producing approximately 11,000–14,000 kWh/year (depending on location and irradiance), assuming an electricity value of €0.30/kWh:
| Average soiling loss | Annual kWh lost | Annual value lost | 25-year cumulative loss |
|---|---|---|---|
| 5% | 550–700 kWh | €165–210 | €4,100–5,250 |
| 10% | 1,100–1,400 kWh | €330–420 | €8,250–10,500 |
| 20% | 2,200–2,800 kWh | €660–840 | €16,500–21,000 |
(Figures exclude electricity price changes and natural system degradation over time.)
Compare these numbers to the cost of appropriate maintenance — and the decision becomes straightforward. Cleaning costs a fraction of what neglect costs.
The Invisible Problem
The deepest risk isn't the loss itself — it's that you won't notice it. You can't see 8% soiling from ground level. Panels producing 90% of potential don't look broken. Your inverter doesn't alarm. The loss hides in plain sight, month after month.
This is why condition-based monitoring matters more than calendar-based cleaning. Smart monitoring platforms can detect abnormal production patterns caused by soiling, shading, or equipment issues — comparing actual output against expected performance based on real-time weather and irradiance data. When the system identifies a deviation, it triggers investigation and targeted response before small losses compound into significant financial impact.
Through SKYWORTH's intelligent energy management platform and professional O&M support, homeowners can identify performance losses early, reduce unnecessary maintenance, and keep their solar investment operating at its designed potential. Clean when the data says clean. Not when panels look dirty to the naked eye from two stories below.


Sign up to our latest blog
By signing up for our newsletter, you agree to the termsoutlined in our privacy policy. You can unsubscribe atany time.